Investors in Canada have long been known for their home bias, favouring local leaders over those from far and wide. This trend is also evident in the recent strong inflows into Canadian equity ETFs, which have already attracted $4 billion year-to-date, according to industry data1.
For investors seeking dividend growth, Canadian equities also offer a compelling opportunity, according to Bank of America strategist Ohsung Kwon, who forecasts a banner year for dividend payers on the TSX.
In 2024, the TSX Composite soared 18.5% – its best year since 2021 thanks to a boost in commodity-linked sectors. With a total market capitalization of $4.2 trillion, the TSX is home to more than 220 companies listed on this Canadian benchmark index.
With so many options in the investing marketplace, how can investors pinpoint the top performers in a product as liquid and transparent as an exchange-traded fund (ETF)?
Introducing Global X’s Best of Canada ETF Suite
Global X’s Best of Canada ETF suite is designed to offer targeted exposure to Canada’s largest and most liquid companies across key sectors and subsectors. These strategies represent a first of their kind in our country, with an exclusive focus on the heavyweights that dominate Canadian markets and provide essential products and services to everyday consumers.
With highly concentrated portfolios, the Best of Canada ETFs could be an attractive option for investors looking for a simple, efficient and liquid way to gain access to the country’s economic leaders.
This blog gives an overview of funds that are focused on the biggest names in their respective sectors:
- Global X Equal Weight Canadian REITs Index ETF (REIT)
- Global X Equal Weight Canadian Groceries & Staples Index ETF (MART)
- Global X Equal Weight Canadian Insurance Index ETF (SAFE)
- Global X Equal Weight Canadian Telecommunications Index ETF (RING)
- Global X Equal Weight Canadian Banks Index ETF (HBNK)
- Global X Equal Weight Canadian Oil & Gas Index ETF (NRGY)
- Global X Equal Weight Canadian Pipelines Index ETF (PPLN)
- Global X Equal Weight Canadian Utilities Index ETF (UTIL)

“When we looked at the investment opportunity here, we realized that there wasn’t a strategy that offered Canadian investors a way to easily access major names in their respective businesses here,” says Chris McHaney, Executive Vice President, Head of Investment Management and Strategy at Global X.
“That’s why Global X launched its Best of Canada range, to offer the opportunity to potentially match those increased costs at the checkout with investment growth.”
Real Estate
Real estate investment trusts (REITs) offer Canadian investors a convenient, tax-efficient way to gain exposure to income-generating properties—without needing to directly buy or manage physical assets. They pool investor capital to acquire and operate a portfolio of real estate holdings, typically across asset classes such as residential, retail, industrial, and office.
Since their introduction to Canada in 1993, REITs have provided a reliable stream of dividend income while helping investors diversify beyond traditional equities and fixed income. Today, 16 REITs are included in the S&P/TSX Composite Index, representing a combined market capitalization of nearly $47 billion as of April 22, 2025.
REITs also offer access to sectors that may be difficult for individuals to invest in directly—such as commercial office space or large-scale retail—while also helping to mitigate localized market risks. Larger REITs often hold diversified portfolios spanning regions and business sectors, which can help smooth returns even when certain property markets face headwinds.

| Name | Ticker | Index Exposure | Exchange | Management Fee1 |
| Global X Equal Weight Canadian REITs Index ETF | REIT | Mirae Asset Equal Weight Canadian REITs Index | TSX | 0.00% |
Global X’s REIT offers investors the opportunity to gain real estate exposure through a diversified equal-weight portfolio of Canadian REITs, allowing participation in potential rental income and long-term capital appreciation from high-quality properties.
Designed to provide a consistent monthly income with an opportunity for growth, REIT offers a diversified approach to real estate investing across various types of properties such as office buildings, apartment complexes, and shopping centers, that can help mitigate sector-specific risks and enhance overall portfolio stability.
Groceries
Historically, the grocery and staples sector has functioned as a defensive subsector that investors favour during periods of uncertainty. After all, everybody needs to eat.
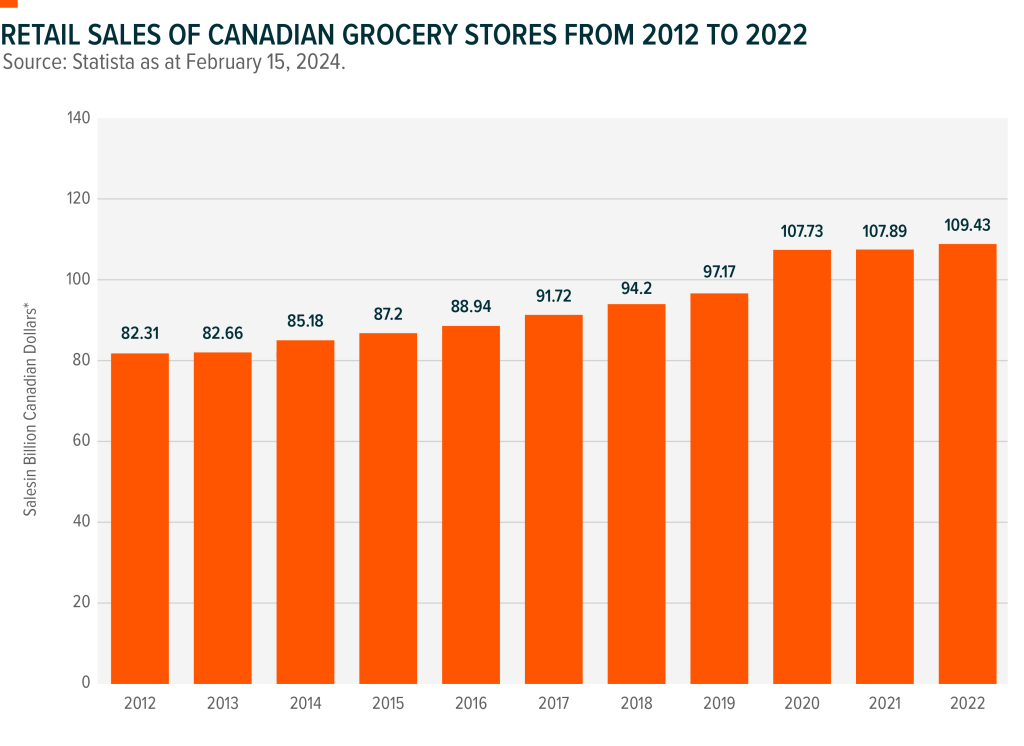
Revenue from Canada’s grocery industry reached $113 billion in 2023. The chart below shows how grocery revenue has grown year-over-year since 2012 as the country has seen growing demographic changes and factors such as higher input costs, Russia’s invasion of Ukraine, and supply chain disruptions contributing to increases in food prices.
Canada’s grocery industry is dominated by three major companies: Loblaws, Empire Company Limited (which operates Sobeys), and Metro. In 2023, these three collectively reported over $111 billion in sales and earned more than $3.86 billion in profits.3
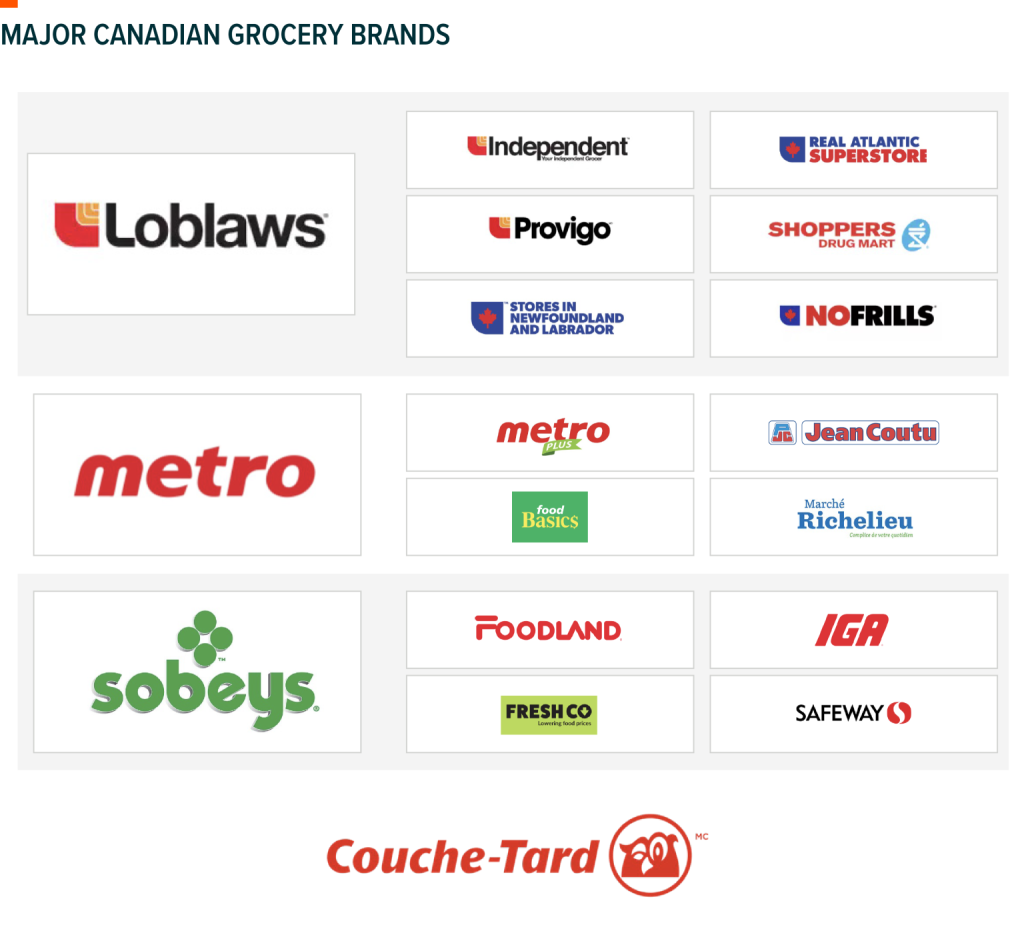
Controlling approximately 59% of the overall grocery market, at the end of Q3 2024, Loblaws, Empire and Metro stocks were collectively up 80%.4
How can investors potentially gain from Canadian grocery dominance?
MART seeks to replicate the performance of the Mirae Asset Equal Weight Canadian Groceries & Staples Index, an equal-weighted index that provides exposure to the largest Canadian food and staples retail companies.
In addition, MART features Alimentation Couche-Tard Inc. (“Couche-Tard”), Canada’s leading convenience store chain business and among the five-largest chains in the world. Couche-Tard had profits of $2.99 billion in 2023,5 making it one of Canada’s most valuable companies. Recently, Couche-Tard even announced its intention to purchase Japan’s Seven & I Holdings, owner of 7-Eleven, one of the world’s most recognizable convenience store chains, to increase its presence and business potential on a global level.
With MART, investors have an easy way to access these major names in the grocery business. It also provides an opportunity to potentially offset rising grocery and consumer goods costs with growth in their investment portfolios.
MART could also be used as a potential inflation hedge as grocery industry profits contribute to rises in food prices, which have been passed on to consumers.
How can investors potentially gain from Canadian grocery dominance?
MART seeks to replicate the performance of the Mirae Asset Equal Weight Canadian Groceries & Staples Index, an equal-weighted index that provides exposure to the largest Canadian food and staples retail companies.
In addition, MART features Alimentation Couche-Tard Inc. (“Couche-Tard”), Canada’s leading convenience store chain business and among the five-largest chains in the world. Couche-Tard had profits of $2.99 billion in 2023,5 making it one of Canada’s most valuable companies. Recently, Couche-Tard even announced its intention to purchase Japan’s Seven & I Holdings, owner of 7-Eleven, one of the world’s most recognizable convenience store chains, to increase its presence and business potential on a global level.
With MART, investors have an easy way to access these major names in the grocery business. It also provides an opportunity to potentially offset rising grocery and consumer goods costs with growth in their investment portfolios. MART could also be used as a potential inflation hedge as grocery industry profits contribute to rises in food prices, which have been passed on to consumers.

| Name | Ticker | Index Exposure | Exchange | Management Fee* |
| Global X Equal Weight Canadian Groceries & Staples Index ETF | MART | Mirae Asset Equal Weight Canadian Groceries & Staples Index | TSX | 0.00% |
Insurance
Another major Canadian sector concentrated into a small group of major players is the insurance industry. Much like Canada’s Big Six Banks, this sector comprises major life insurers such as Manulife, Great-West Lifeco and Sun Life.

Another member is auto and property insurer Intact Insurance, which has a 19-year streak of dividend payouts.
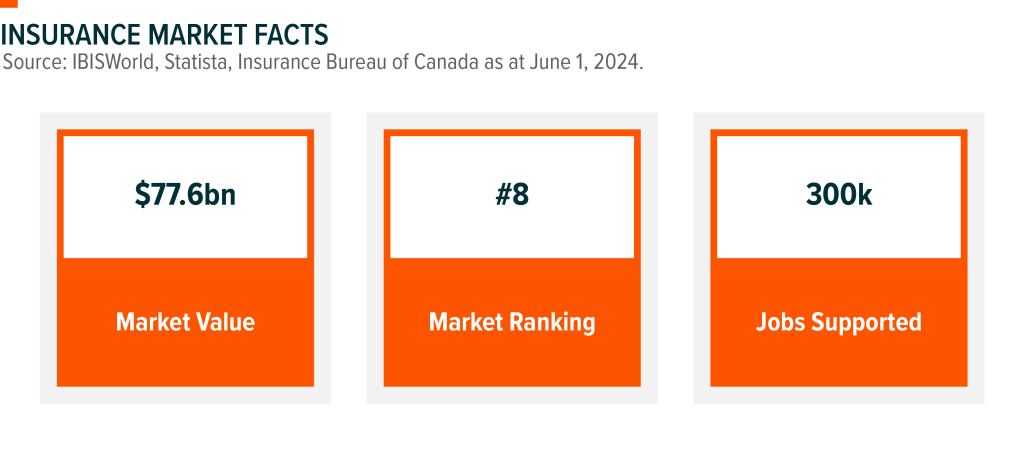
As a whole (including property, casualty and direct insurance), Canada’s insurance market was worth $55.7 billion in 2024 and overall is the eighth insurance market in the world. The property and casualty insurance business contributes about $38 billion to Canada’s economy and represents approximately 300,000 jobs across the country.
While Canadian banks have been a popular way for Canadians to access financial exposure, the insurance subsector could provide greater opportunity, particularly as these companies have seen stronger growth in recent years.
SAFE seeks to replicate the performance of the Mirae Asset Equal Weight Canadian Insurance Index, an equal-weighted index designed to provide exposure to Canada’s largest insurance companies.

| Name | Ticker | Index Exposure | Exchange | Management Fee* |
| Global X Equal Weight Canadian Insurance Index ETF | SAFE | Mirae Asset Equal Weight Canadian Insurance Index | TSX | 0.00% |
Telecommunications
From the telegraph to the television and the smartphone, the telecommunications (telecoms) sector makes the transmission of ideas and commerce possible. In Canada right now, there are 41 million Canadians who hold 36 million cell phone mobile plans. You’d be hard-pressed to find another industry that has the same product penetration.
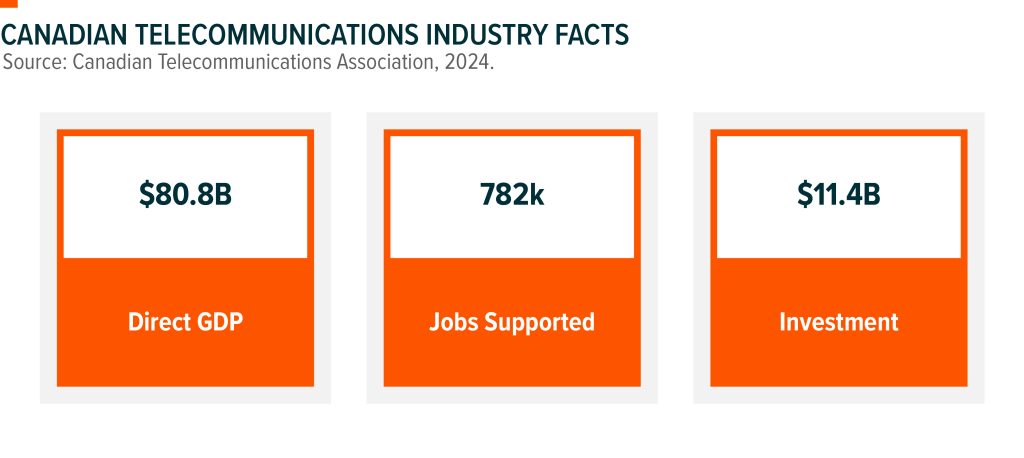
The retail wireless market is dominated by just three major players: Rogers, Bell and TELUS. Here’s how the telecoms sector contributed to the Canadian economy last year:
The top three telecom companies in Canada hold over 88% of the country’s wireless market share. This is how that market dominance compares to other nations:
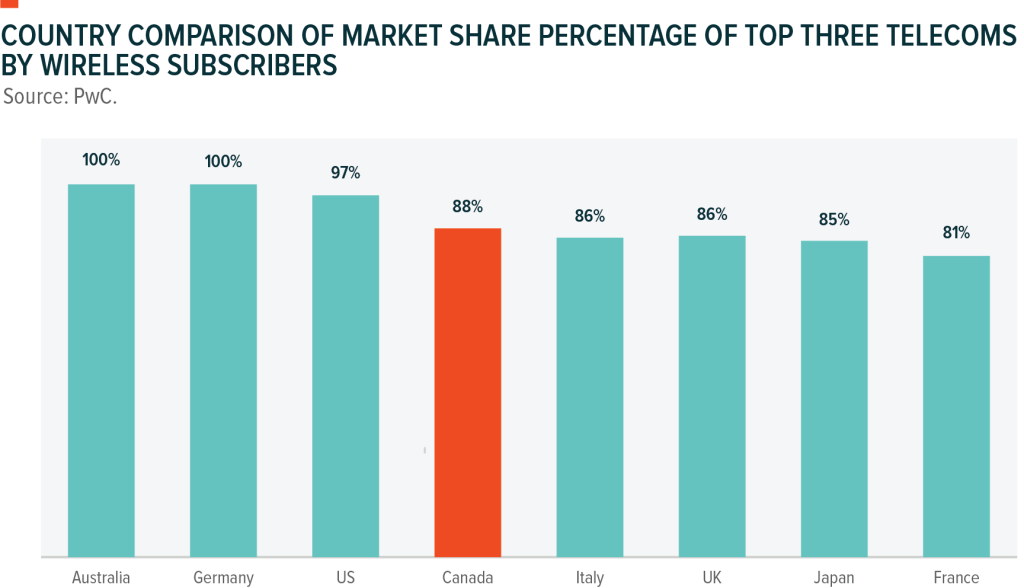
Note: Above data provided as at June 2024.
Canada has some of the highest costs in the world for data, despite Government intervention to reduce prices for consumers. Amid Canada’s growing population, revenues for telecoms are up. In 2023, Canada’s three largest telecom companies—BCE, Rogers, and TELUS—collectively reported more than $64 billion in sales and earned $3.76 billion in profit.15
That said, the high costs associated with developing wireless infrastructure across the world’s second-largest country, along with regulatory barriers for new entrants, likely reinforce the ongoing market dominance of these three companies.
Telecoms stocks display interest rate sensitivity due to the industry’s capital-intensive nature and may benefit in a declining rate environment as financing costs go down.
Bell, Rogers and Telus are the sole holdings within RING, which seeks to replicate the performance of the Mirae Asset Equal Weight Canadian Telecommunications Index, an equal-weighted index of the largest Canadian telecoms companies.

| Name | Ticker | Index Exposure | Exchange | Management Fee* |
| Global X Equal Weight Canadian Telecommunications Index ETF | RING | Mirae Asset Equal Weight Canadian Telecommunications Index | TSX | 0.00% |
Banks
As one of Canada’s largest economic sectors, the Canadian Big Six Banks have traditionally offered a stable bastion within the broader Canadian equity landscape. During the most recent earnings season of early 2025, all six major banks posted first-quarter earnings that beat analysts’ estimates.
According to the Canadian Bankers Association:
- Canadian banks contributed over $70 billion (or 3.5%) of Canada’s GDP in 2023.
- They paid out $28 billion in dividends in 2023 to shareholders.
- Canadian banks employ close to 300,000 Canadians.
Canada’s Bix Six banks – Bank of Nova Scotia, Bank of Montreal, National Bank of Canada, Royal Bank of Canada, Toronto-Dominion Bank and Canadian Imperial Bank of Commerce – can be found in HBNK, which seeks to replicate the performance of an index of equal-weighted equity securities of diversified Canadian banks. HBNK is designed to provide consistent monthly income with an opportunity for growth.

| Name | Ticker | Index Exposure | Exchange | Management Fee* |
| Global X Equal Weight Canadian Banks Index ETF | HBNK | Solactive Equal Weight Canada Banks Index | TSX | 0.09% |
Energy
The oil and gas industry has been an important part of the economy since the middle of the nineteenth century. Canada was the world’s fourth-largest oil producer in 2023, producing 5.1 million barrels per day. Most of the nation’s oil production mainly comes from western Canada, contributing around 96% of the total production in 2023, with the remainder produced mostly in Newfoundland and Labrador.
- Canada holds 11% of the world’s oil reserves
- The sector directly employed 285,600 people and indirectly supported over 411,400 jobs.
- In 2023, Canada’s energy sector accounted for approximately 10.3% of the nominal GDP.19
Finding and tapping oil and gas is only the first stage in a production chain that turns the raw commodity into the fuel that powers your car or into common household items such as plastics, cosmetics and pharmaceuticals. Getting the raw commodity from the drilling rig to the gas station can generally be separated into three stages:
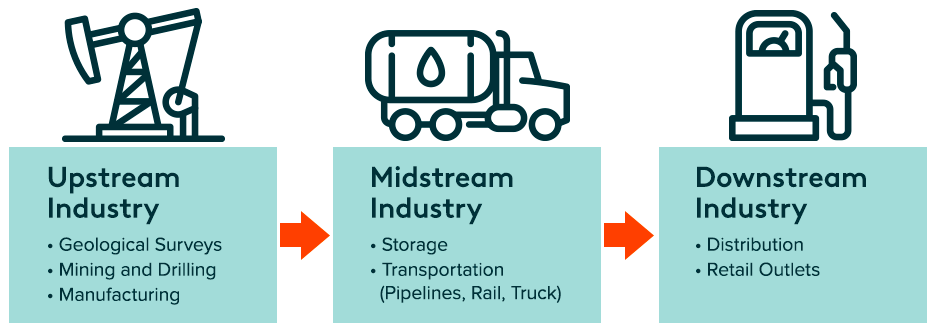
NRGY provides direct exposure to some of the largest and most liquid Canadian companies in the oil and gas industry.
Designed to provide a consistent monthly income, NRGY allocates an equal weight to each security, allowing investors to diversify their exposure within Canada’s oil & gas sector, mitigating the concentration risk associated with individual company performance.

| Name | Ticker | Index Exposure | Exchange | Management Fee* |
| Global X Equal Weight Canadian Oil & Gas Index ETF | NRGY | Mirae Asset Equal Weight Canadian Oil & Gas Index | TSX | 0.00% |
Energy Infrastructure
With oil and gas reserves across Western Canada and offshore in the Maritimes, Canada has a substantial network of over 840,000 kilometers of pipelines.
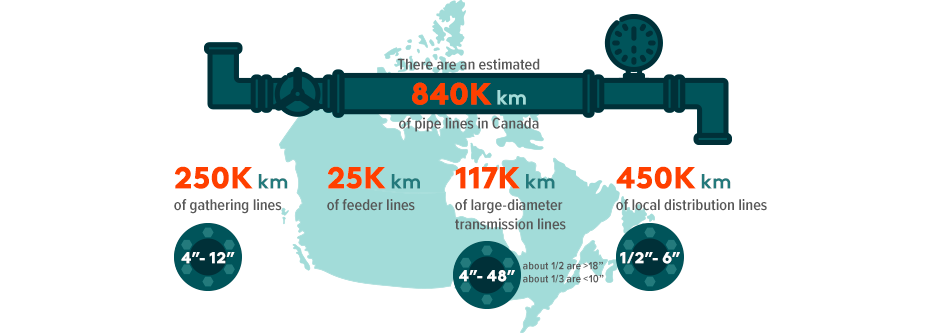
Source: Natural Resources Canada
PPLN is Canada’s first exchange-traded fund dedicated solely to midstream oil and gas firms, offering investors exposure to companies that transport and distribute energy products, linking upstream producers with refineries and distributors.
Unlike energy producers, pipeline operators typically experience lower volatility, as their revenue is anchored by long-term contracts rather than fluctuating commodity prices. While midstream firms are not immune to broader energy market trends, their business models tend to provide steadier cash flows.
PPLN also adds diversification to an energy-focused portfolio. Midstream firms operate with distinct risk profiles compared to upstream explorers and downstream refiners, potentially smoothing out sector-specific volatility.

| Name | Ticker | Index Exposure | Exchange | Management Fee1 |
| Global X Equal Weight Canadian Pipelines Index ETF2 | PPLN | Mirae Asset Equal Weight Canadian Pipeline Index3 | TSX | 0.00% |
1Plus applicable sales tax. ETF is rebated until December 31, 2025.
2Formerly Global X Pipelines & Energy Services Index ETF
3Formerly Solactive Pipelines & Energy Services Index
Utilities
Utilities are traditionally known for their defensive properties, such as stable cash flows and high dividend payout ratios, even during volatile market conditions.
Going beyond traditional utilities exposure to include pipelines and telecoms companies, UTIL offers investors the potential for consistent income through dividend payments from high dividend-paying Canadian utility service companies listed on the TSX that offer historically higher yields relative to sectors such as Information Technology and Consumer Goods.

| Name | Ticker | Index Exposure | Exchange | Management Fee1 |
| Global X Equal Weight Canadian Utilities Index ETF2 | UTIL | Mirae Asset Equal Weight Canadian Utilities Index3 | TSX | 0.00% |
1Plus applicable sales tax. ETF is rebated until December 31, 2025.
2Formerly Global X Canadian Utility Services High Dividend Index ETF
3Formerly the Solactive Canadian Utility Services High Dividend Index
With Canadian investors often favouring a home field advantage, Global X’s Best of Canada ETF Suite provides targeted exposure to the largest and most liquid companies across sectors essential to the Canadian economy – Groceries, Insurance, Telecoms, Banking, Oil & Gas, Utilities and Pipelines – offering both stability and growth potential.
For those looking for an opportunity to simplify their investment strategy and access Canada’s market leaders, the Best of Canada ETF Suite offers a focused, efficient option to capitalize on Canada’s top-performing companies.
Related ETFs
REIT – Global X Equal Weight Canadian REITs Index ETF
MART – Global X Equal Weight Canadian Groceries & Staples Index ETF
SAFE – Global X Equal Weight Canadian Insurance Index ETF
RING – Global X Equal Weight Canadian Telecommunications Index ETF
HBNK – Global X Equal Weight Canadian Banks Index ETF
NRGY – Global X Equal Weight Canadian Oil & Gas Index ETF
PPLN – Global X Equal Weight Canadian Pipelines Index ETF
UTIL – Global X Equal Weight Canadian Utilities Index ETF
Sources:
1 RBC Capital Markets – Global ETF Roundup, October 18, 2024.
2 Bloomberg data accessed October 22, 2024.
3 Ibid.
4 Ibid.
5 Ibid.
6 Ibid.
7 Ibid.
8 Ibid.
9 Ibid.
10 Bloomberg data accessed November 1, 2024.
11 Bloomberg data accessed October 22, 2024.
12 Ibid.
13 Ibid.
14 Ibid.
15 Ibid.
16 Ibid.
17 Ibid.
18 Ibid.
19 Canadian Centre for Energy Information, October 2024.
DISCLAIMERS
Effective March 4, 2025, the investment objectives, ETF names, and management fees of the Global X Equal Weight Canadian Pipelines Index ETF (PPLN) and the Global X Equal Weight Canadian Utilities Index ETF (UTIL) were updated following the necessary unitholder and regulatory approvals. For full details, please refer to the press release and the disclosure documents available at www.GlobalX.ca.
Commissions, management fees and expenses all may be associated with an investment in products (the “Global X Funds”) managed by Global X Investments Canada Inc. The Global X Funds are not guaranteed, their values change frequently and past performance may not be repeated. The prospectus contains important detailed information about the Global X Funds. Please read the relevant prospectus before investing.
Mirae Asset Global Index Private Limited (an affiliate of the Manager) owns all rights to the trademark, name and intellectual property associated with the Underlying Indices of the Index ETFs (in this disclaimer, the “Mirae Asset Indices”). No representation is made by Mirae Asset Global Index Private Limited that the Mirae Asset Indices are accurate or complete or that investment in a Mirae Asset Index or an Index ETF will be profitable or suitable for any person. The Mirae Asset Indices are administered and calculated by Mirae Asset Global Index Private Limited and Mirae Asset Global Index Private Limited will have no liability for any error in the calculation of the Mirae Asset Indices. Mirae Asset Global Index Private Limited does not guarantee that the Mirae Asset Indices or their underlying methodology is accurate or complete.
The financial instrument is not sponsored, promoted, sold, or supported in any other manner by Solactive AG nor does Solactive AG offer any express or implicit guarantee or assurance either with regard to the results of using the Index and/or Index trade name or the Index Price at any time or in any other respect. The Index is calculated and published by Solactive AG. Solactive AG uses its best efforts to ensure that the Index is calculated correctly. Irrespective of its obligations towards the Issuer, Solactive AG has no obligation to point out errors in the Index to third parties including but not limited to investors and/or financial intermediaries of the financial instrument. Neither publication of the Index by Solactive AG nor the licensing of the Index or Index trade name for the purpose of use in connection with the financial instrument constitutes a recommendation by Solactive AG to invest capital in said financial instrument nor does it in any way represent an assurance or opinion of Solactive AG with regard to any investment in this financial instrument.
Certain statements may constitute a forward-looking statement, including those identified by the expression “expect” and similar expressions (including grammatical variations thereof). The forward-looking statements are not historical facts but reflect the author’s current expectations regarding future results or events. These forward-looking statements are subject to a number of risks and uncertainties that could cause actual results or events to differ materially from current expectations. These and other factors should be considered carefully and readers should not place undue reliance on such forward-looking statements. These forward-looking statements are made as of the date hereof and the authors do not undertake to update any forward-looking statement that is contained herein, whether as a result of new information, future events or otherwise, unless required by applicable law.
This communication is intended for informational purposes only and does not constitute an offer to sell or the solicitation of an offer to purchase investment products (the “Global X Funds”) managed by Global X Investments Canada Inc. and is not, and should not be construed as, investment, tax, legal or accounting advice, and should not be relied upon in that regard. Individuals should seek the advice of professionals, as appropriate, regarding any particular investment. Investors should consult their professional advisors prior to implementing any changes to their investment strategies. These investments may not be suitable to the circumstances of an investor.
The views/opinions expressed herein are solely those of the author(s) and may not necessarily be the views of Global X Investments Canada Inc. All comments, opinions and views expressed are generally based on information available as of the date of publication and should not be considered as advice to purchase or to sell mentioned securities. Before making any investment decision, please consult your investment advisor or advisors.
Global X Investments Canada Inc. (“Global X”) is a wholly-owned subsidiary of Mirae Asset Global Investments Co., Ltd. (“Mirae Asset”), the Korea-based asset management entity of Mirae Asset Financial Group. Global X is a corporation existing under the laws of Canada and is the manager, investment manager and trustee of the Global X Funds.
© 2025 Global X Investments Canada Inc. All Rights Reserved.
For more information on Global X Investments Canada Inc. and its suite of ETFs, visit www.GlobalX.ca
Published March 17, 2025.